ctf18 chl12
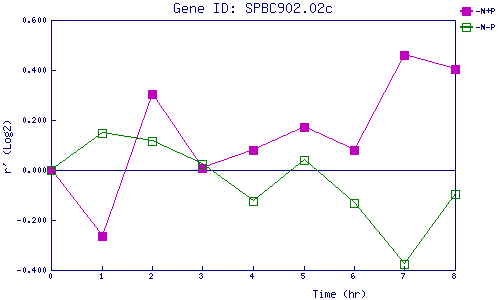
| 0 | 1 | 2 | 3 | 4 | 5 | 6 | 7 | 8 | |
| -N+P | 0.000 | -0.263 | 0.302 | 0.010 | 0.080 | 0.171 | 0.080 | 0.459 | 0.403 |
| -N-P | 0.000 | 0.149 | 0.115 | 0.023 | -0.124 | 0.038 | -0.131 | -0.375 | -0.098 |
|
-N+P: Nitrogen starved in the presence of P-factor -N-P: Nitrogen starved in the absence of P-factor |