| 0 | 1 | 2 | 3 | 4 | 5 | 6 | 7 | 8 | |
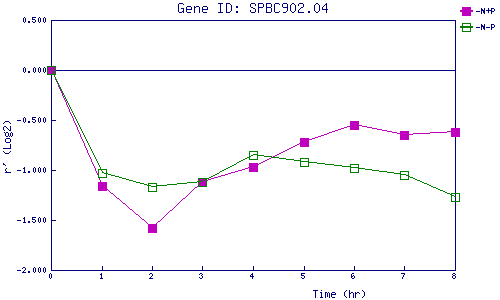
| -N+P | 0.000 | -1.161 | -1.585 | -1.117 | -0.969 | -0.722 | -0.553 | -0.646 | -0.619 |
| -N-P | 0.000 | -1.028 | -1.172 | -1.119 | -0.852 | -0.921 | -0.976 | -1.054 | -1.270 |
|
-N+P: Nitrogen starved in the presence of P-factor -N-P: Nitrogen starved in the absence of P-factor |