apl2
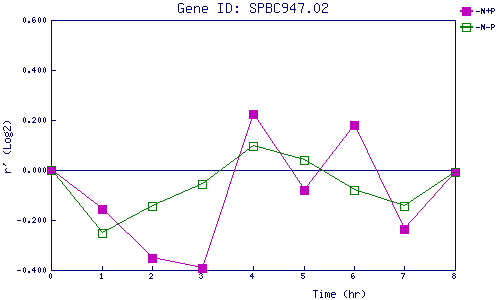
| 0 | 1 | 2 | 3 | 4 | 5 | 6 | 7 | 8 | |
| -N+P | 0.000 | -0.157 | -0.352 | -0.392 | 0.226 | -0.082 | 0.180 | -0.235 | -0.010 |
| -N-P | 0.000 | -0.253 | -0.144 | -0.054 | 0.096 | 0.039 | -0.081 | -0.145 | -0.007 |
|
-N+P: Nitrogen starved in the presence of P-factor -N-P: Nitrogen starved in the absence of P-factor |