| 0 | 1 | 2 | 3 | 4 | 5 | 6 | 7 | 8 | |
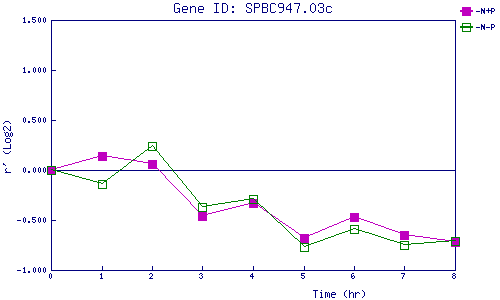
| -N+P | 0.000 | 0.135 | 0.055 | -0.456 | -0.329 | -0.680 | -0.472 | -0.648 | -0.722 |
| -N-P | 0.000 | -0.145 | 0.235 | -0.370 | -0.287 | -0.770 | -0.592 | -0.746 | -0.707 |
|
-N+P: Nitrogen starved in the presence of P-factor -N-P: Nitrogen starved in the absence of P-factor |
