| 0 | 1 | 2 | 3 | 4 | 5 | 6 | 7 | 8 | |
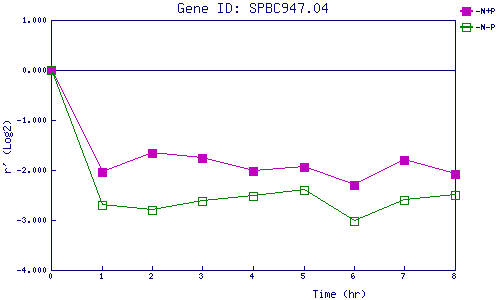
| -N+P | 0.000 | -2.037 | -1.651 | -1.770 | -2.020 | -1.947 | -2.295 | -1.797 | -2.083 |
| -N-P | 0.000 | -2.705 | -2.800 | -2.615 | -2.522 | -2.405 | -3.029 | -2.594 | -2.494 |
|
-N+P: Nitrogen starved in the presence of P-factor -N-P: Nitrogen starved in the absence of P-factor |