| 0 | 1 | 2 | 3 | 4 | 5 | 6 | 7 | 8 | |
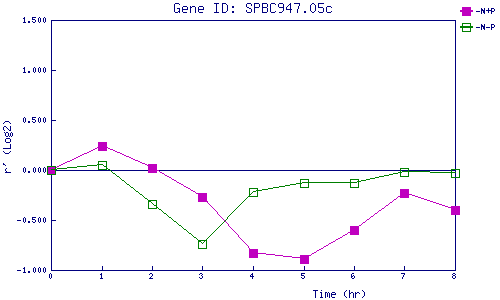
| -N+P | 0.000 | 0.245 | 0.019 | -0.266 | -0.828 | -0.893 | -0.604 | -0.231 | -0.401 |
| -N-P | 0.000 | 0.048 | -0.339 | -0.742 | -0.223 | -0.131 | -0.126 | -0.017 | -0.033 |
|
-N+P: Nitrogen starved in the presence of P-factor -N-P: Nitrogen starved in the absence of P-factor |