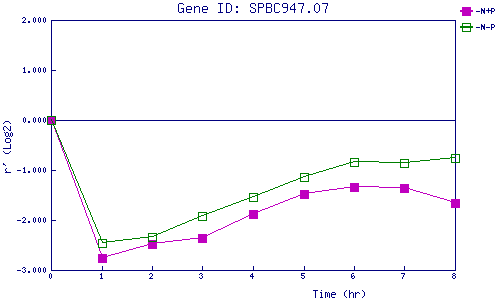
| 0 | 1 | 2 | 3 | 4 | 5 | 6 | 7 | 8 | |
| -N+P | 0.000 | -2.752 | -2.471 | -2.365 | -1.872 | -1.478 | -1.348 | -1.354 | -1.666 |
| -N-P | 0.000 | -2.451 | -2.340 | -1.912 | -1.547 | -1.132 | -0.833 | -0.860 | -0.751 |
|
-N+P: Nitrogen starved in the presence of P-factor -N-P: Nitrogen starved in the absence of P-factor |