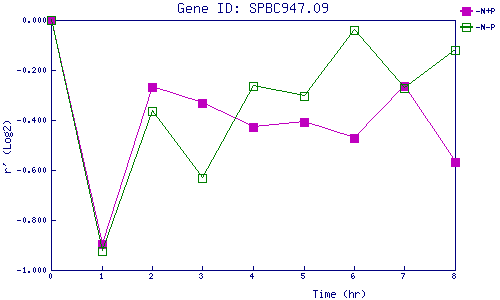
| 0 | 1 | 2 | 3 | 4 | 5 | 6 | 7 | 8 | |
| -N+P | 0.000 | -0.897 | -0.269 | -0.333 | -0.427 | -0.408 | -0.471 | -0.266 | -0.568 |
| -N-P | 0.000 | -0.924 | -0.363 | -0.632 | -0.266 | -0.302 | -0.039 | -0.273 | -0.118 |
|
-N+P: Nitrogen starved in the presence of P-factor -N-P: Nitrogen starved in the absence of P-factor |