kms2
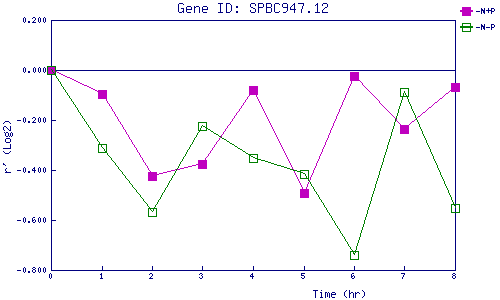
| 0 | 1 | 2 | 3 | 4 | 5 | 6 | 7 | 8 | |
| -N+P | 0.000 | -0.098 | -0.422 | -0.376 | -0.078 | -0.493 | -0.023 | -0.236 | -0.068 |
| -N-P | 0.000 | -0.311 | -0.570 | -0.225 | -0.354 | -0.415 | -0.739 | -0.086 | -0.551 |
|
-N+P: Nitrogen starved in the presence of P-factor -N-P: Nitrogen starved in the absence of P-factor |