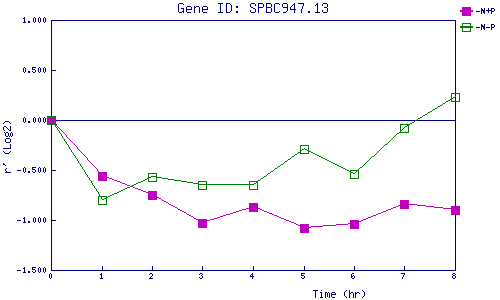
| 0 | 1 | 2 | 3 | 4 | 5 | 6 | 7 | 8 | |
| -N+P | 0.000 | -0.559 | -0.748 | -1.030 | -0.872 | -1.083 | -1.042 | -0.837 | -0.896 |
| -N-P | 0.000 | -0.799 | -0.569 | -0.654 | -0.654 | -0.294 | -0.538 | -0.083 | 0.229 |
|
-N+P: Nitrogen starved in the presence of P-factor -N-P: Nitrogen starved in the absence of P-factor |