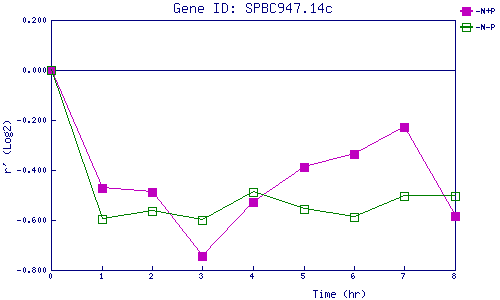
| 0 | 1 | 2 | 3 | 4 | 5 | 6 | 7 | 8 | |
| -N+P | 0.000 | -0.471 | -0.486 | -0.745 | -0.529 | -0.389 | -0.335 | -0.227 | -0.582 |
| -N-P | 0.000 | -0.595 | -0.563 | -0.602 | -0.488 | -0.555 | -0.588 | -0.506 | -0.502 |
|
-N+P: Nitrogen starved in the presence of P-factor -N-P: Nitrogen starved in the absence of P-factor |