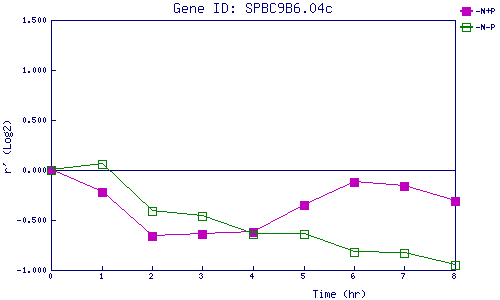
| 0 | 1 | 2 | 3 | 4 | 5 | 6 | 7 | 8 | |
| -N+P | 0.000 | -0.223 | -0.661 | -0.635 | -0.617 | -0.352 | -0.120 | -0.160 | -0.308 |
| -N-P | 0.000 | 0.056 | -0.410 | -0.460 | -0.637 | -0.644 | -0.823 | -0.832 | -0.948 |
|
-N+P: Nitrogen starved in the presence of P-factor -N-P: Nitrogen starved in the absence of P-factor |