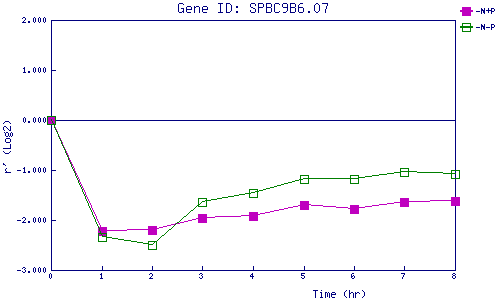
| 0 | 1 | 2 | 3 | 4 | 5 | 6 | 7 | 8 | |
| -N+P | 0.000 | -2.214 | -2.201 | -1.958 | -1.912 | -1.702 | -1.772 | -1.637 | -1.627 |
| -N-P | 0.000 | -2.343 | -2.504 | -1.648 | -1.458 | -1.186 | -1.171 | -1.047 | -1.074 |
|
-N+P: Nitrogen starved in the presence of P-factor -N-P: Nitrogen starved in the absence of P-factor |