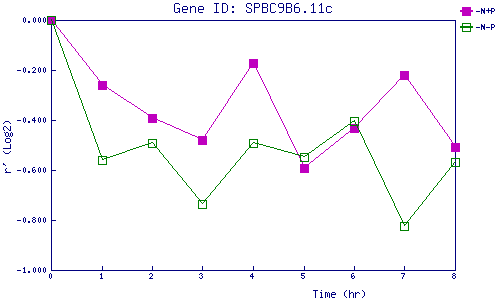
| 0 | 1 | 2 | 3 | 4 | 5 | 6 | 7 | 8 | |
| -N+P | 0.000 | -0.261 | -0.391 | -0.479 | -0.172 | -0.593 | -0.430 | -0.221 | -0.509 |
| -N-P | 0.000 | -0.559 | -0.492 | -0.734 | -0.491 | -0.548 | -0.403 | -0.822 | -0.567 |
|
-N+P: Nitrogen starved in the presence of P-factor -N-P: Nitrogen starved in the absence of P-factor |