mcs2
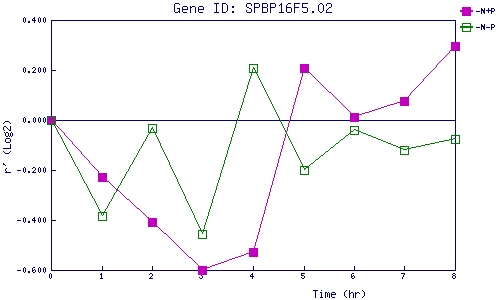
| 0 | 1 | 2 | 3 | 4 | 5 | 6 | 7 | 8 | |
| -N+P | 0.000 | -0.228 | -0.406 | -0.599 | -0.528 | 0.206 | 0.013 | 0.077 | 0.296 |
| -N-P | 0.000 | -0.386 | -0.033 | -0.456 | 0.209 | -0.201 | -0.042 | -0.120 | -0.077 |
|
-N+P: Nitrogen starved in the presence of P-factor -N-P: Nitrogen starved in the absence of P-factor |