ubcp3 ubc3
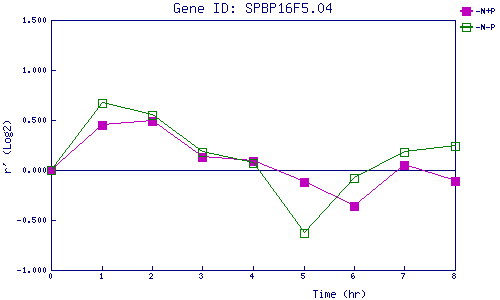
| 0 | 1 | 2 | 3 | 4 | 5 | 6 | 7 | 8 | |
| -N+P | 0.000 | 0.446 | 0.486 | 0.126 | 0.087 | -0.122 | -0.361 | 0.051 | -0.111 |
| -N-P | 0.000 | 0.666 | 0.553 | 0.179 | 0.066 | -0.633 | -0.077 | 0.176 | 0.244 |
|
-N+P: Nitrogen starved in the presence of P-factor -N-P: Nitrogen starved in the absence of P-factor |