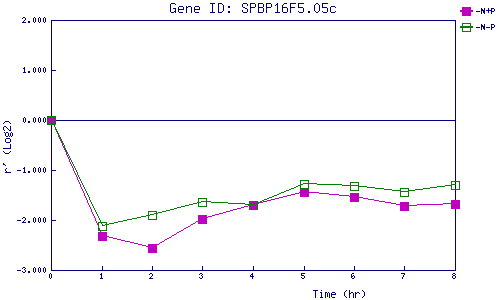
| 0 | 1 | 2 | 3 | 4 | 5 | 6 | 7 | 8 | |
| -N+P | 0.000 | -2.316 | -2.552 | -1.974 | -1.705 | -1.431 | -1.542 | -1.721 | -1.690 |
| -N-P | 0.000 | -2.120 | -1.901 | -1.643 | -1.705 | -1.288 | -1.311 | -1.440 | -1.292 |
|
-N+P: Nitrogen starved in the presence of P-factor -N-P: Nitrogen starved in the absence of P-factor |