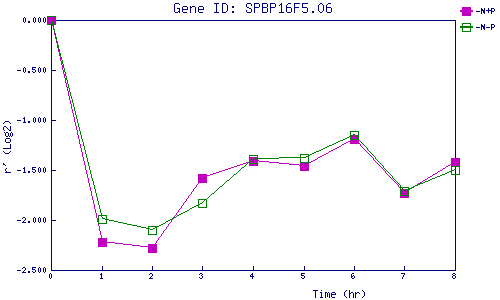
| 0 | 1 | 2 | 3 | 4 | 5 | 6 | 7 | 8 | |
| -N+P | 0.000 | -2.221 | -2.280 | -1.580 | -1.414 | -1.457 | -1.190 | -1.729 | -1.420 |
| -N-P | 0.000 | -1.989 | -2.099 | -1.826 | -1.394 | -1.380 | -1.149 | -1.711 | -1.497 |
|
-N+P: Nitrogen starved in the presence of P-factor -N-P: Nitrogen starved in the absence of P-factor |