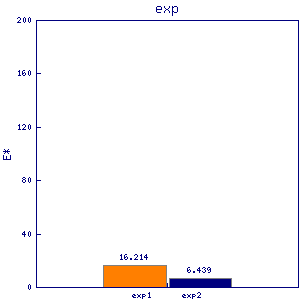
apm1
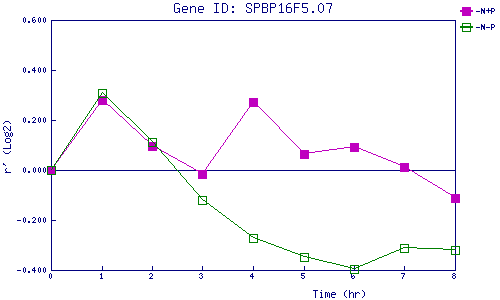
| 0 | 1 | 2 | 3 | 4 | 5 | 6 | 7 | 8 | |
| -N+P | 0.000 | 0.281 | 0.094 | -0.017 | 0.271 | 0.063 | 0.091 | 0.012 | -0.112 |
| -N-P | 0.000 | 0.309 | 0.110 | -0.119 | -0.270 | -0.348 | -0.397 | -0.312 | -0.321 |
|
-N+P: Nitrogen starved in the presence of P-factor -N-P: Nitrogen starved in the absence of P-factor |