mor2 cps12
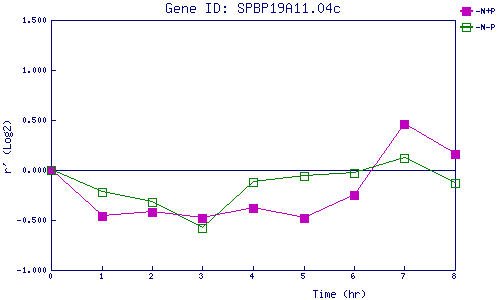
| 0 | 1 | 2 | 3 | 4 | 5 | 6 | 7 | 8 | |
| -N+P | 0.000 | -0.464 | -0.415 | -0.481 | -0.379 | -0.479 | -0.249 | 0.461 | 0.162 |
| -N-P | 0.000 | -0.218 | -0.317 | -0.579 | -0.118 | -0.057 | -0.033 | 0.117 | -0.132 |
|
-N+P: Nitrogen starved in the presence of P-factor -N-P: Nitrogen starved in the absence of P-factor |