pi029
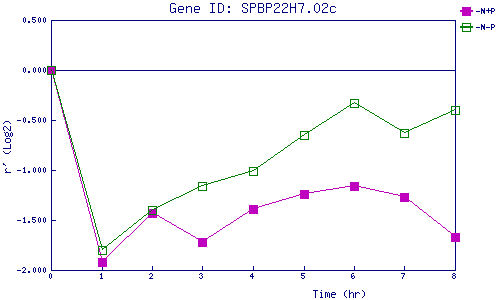
| 0 | 1 | 2 | 3 | 4 | 5 | 6 | 7 | 8 | |
| -N+P | 0.000 | -1.918 | -1.426 | -1.717 | -1.392 | -1.239 | -1.159 | -1.266 | -1.671 |
| -N-P | 0.000 | -1.805 | -1.397 | -1.165 | -1.013 | -0.650 | -0.329 | -0.628 | -0.395 |
|
-N+P: Nitrogen starved in the presence of P-factor -N-P: Nitrogen starved in the absence of P-factor |