pi026
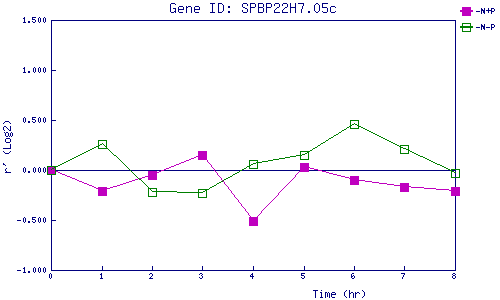
| 0 | 1 | 2 | 3 | 4 | 5 | 6 | 7 | 8 | |
| -N+P | 0.000 | -0.212 | -0.046 | 0.152 | -0.514 | 0.031 | -0.104 | -0.168 | -0.214 |
| -N-P | 0.000 | 0.256 | -0.216 | -0.229 | 0.062 | 0.152 | 0.464 | 0.214 | -0.033 |
|
-N+P: Nitrogen starved in the presence of P-factor -N-P: Nitrogen starved in the absence of P-factor |