pmc1
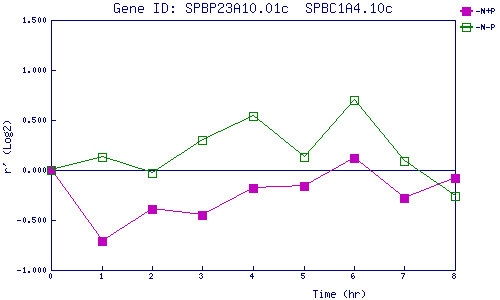
| 0 | 1 | 2 | 3 | 4 | 5 | 6 | 7 | 8 | |
| -N+P | 0.000 | -0.711 | -0.387 | -0.450 | -0.175 | -0.158 | 0.118 | -0.283 | -0.080 |
| -N-P | 0.000 | 0.127 | -0.029 | 0.301 | 0.545 | 0.133 | 0.699 | 0.089 | -0.263 |
|
-N+P: Nitrogen starved in the presence of P-factor -N-P: Nitrogen starved in the absence of P-factor |