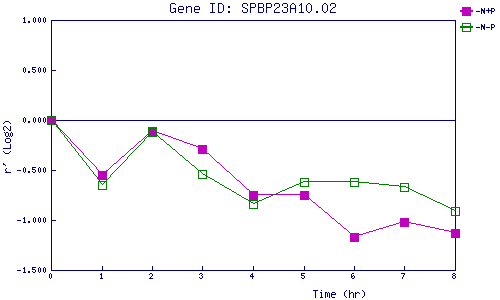
| 0 | 1 | 2 | 3 | 4 | 5 | 6 | 7 | 8 | |
| -N+P | 0.000 | -0.552 | -0.109 | -0.291 | -0.747 | -0.751 | -1.170 | -1.022 | -1.133 |
| -N-P | 0.000 | -0.648 | -0.116 | -0.543 | -0.837 | -0.617 | -0.618 | -0.673 | -0.908 |
|
-N+P: Nitrogen starved in the presence of P-factor -N-P: Nitrogen starved in the absence of P-factor |