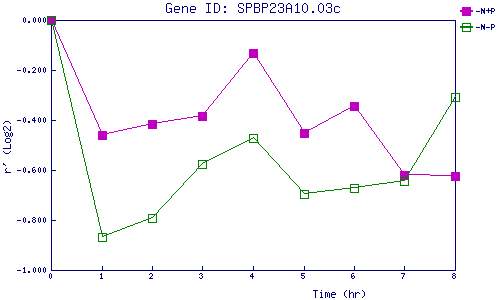
| 0 | 1 | 2 | 3 | 4 | 5 | 6 | 7 | 8 | |
| -N+P | 0.000 | -0.459 | -0.414 | -0.382 | -0.131 | -0.451 | -0.345 | -0.619 | -0.624 |
| -N-P | 0.000 | -0.868 | -0.794 | -0.578 | -0.474 | -0.695 | -0.672 | -0.643 | -0.308 |
|
-N+P: Nitrogen starved in the presence of P-factor -N-P: Nitrogen starved in the absence of P-factor |