rpa2
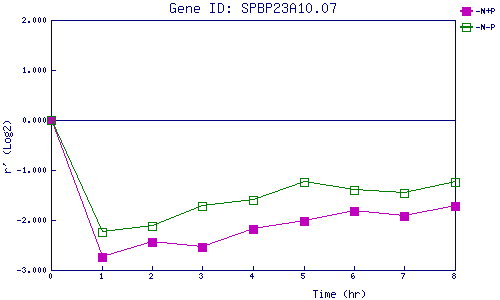
| 0 | 1 | 2 | 3 | 4 | 5 | 6 | 7 | 8 | |
| -N+P | 0.000 | -2.749 | -2.446 | -2.549 | -2.174 | -2.019 | -1.811 | -1.915 | -1.713 |
| -N-P | 0.000 | -2.244 | -2.113 | -1.716 | -1.591 | -1.233 | -1.409 | -1.454 | -1.250 |
|
-N+P: Nitrogen starved in the presence of P-factor -N-P: Nitrogen starved in the absence of P-factor |