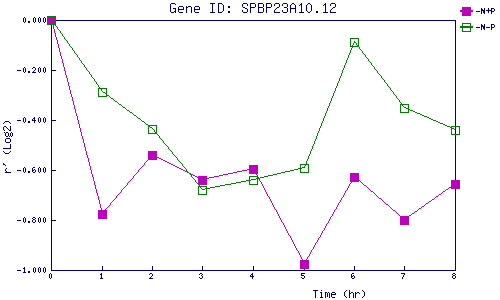
| 0 | 1 | 2 | 3 | 4 | 5 | 6 | 7 | 8 | |
| -N+P | 0.000 | -0.775 | -0.539 | -0.640 | -0.595 | -0.975 | -0.628 | -0.802 | -0.657 |
| -N-P | 0.000 | -0.287 | -0.435 | -0.678 | -0.640 | -0.594 | -0.087 | -0.354 | -0.438 |
|
-N+P: Nitrogen starved in the presence of P-factor -N-P: Nitrogen starved in the absence of P-factor |