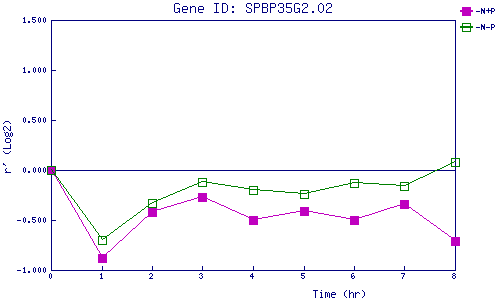
| 0 | 1 | 2 | 3 | 4 | 5 | 6 | 7 | 8 | |
| -N+P | 0.000 | -0.882 | -0.417 | -0.268 | -0.501 | -0.410 | -0.504 | -0.338 | -0.706 |
| -N-P | 0.000 | -0.695 | -0.331 | -0.115 | -0.205 | -0.243 | -0.131 | -0.163 | 0.085 |
|
-N+P: Nitrogen starved in the presence of P-factor -N-P: Nitrogen starved in the absence of P-factor |