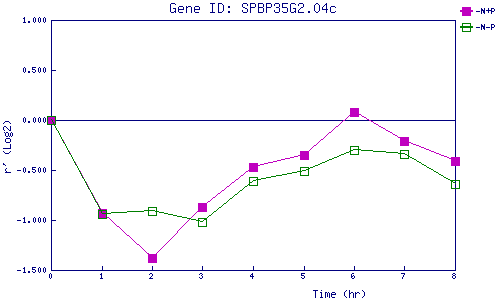
| 0 | 1 | 2 | 3 | 4 | 5 | 6 | 7 | 8 | |
| -N+P | 0.000 | -0.931 | -1.379 | -0.866 | -0.469 | -0.348 | 0.083 | -0.213 | -0.412 |
| -N-P | 0.000 | -0.938 | -0.910 | -1.022 | -0.614 | -0.509 | -0.299 | -0.338 | -0.644 |
|
-N+P: Nitrogen starved in the presence of P-factor -N-P: Nitrogen starved in the absence of P-factor |