ilv1
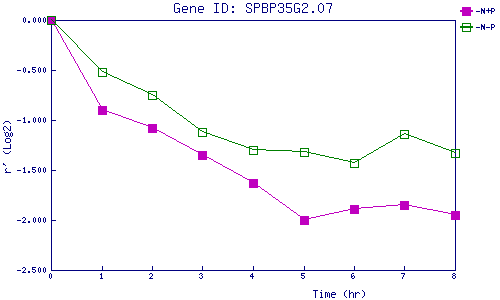
| 0 | 1 | 2 | 3 | 4 | 5 | 6 | 7 | 8 | |
| -N+P | 0.000 | -0.904 | -1.085 | -1.354 | -1.633 | -2.005 | -1.888 | -1.847 | -1.946 |
| -N-P | 0.000 | -0.520 | -0.752 | -1.120 | -1.303 | -1.319 | -1.430 | -1.145 | -1.334 |
|
-N+P: Nitrogen starved in the presence of P-factor -N-P: Nitrogen starved in the absence of P-factor |