| 0 | 1 | 2 | 3 | 4 | 5 | 6 | 7 | 8 | |
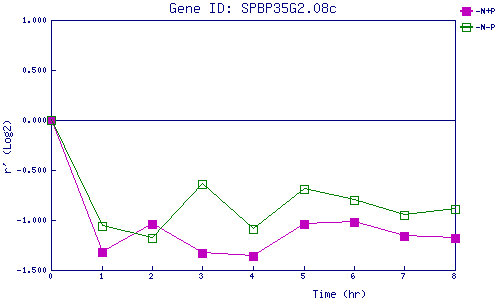
| -N+P | 0.000 | -1.320 | -1.042 | -1.331 | -1.357 | -1.037 | -1.020 | -1.157 | -1.184 |
| -N-P | 0.000 | -1.061 | -1.179 | -0.642 | -1.088 | -0.694 | -0.799 | -0.951 | -0.892 |
|
-N+P: Nitrogen starved in the presence of P-factor -N-P: Nitrogen starved in the absence of P-factor |