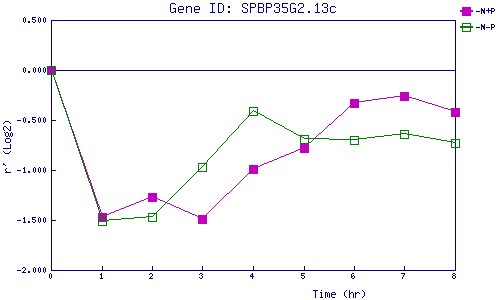
| 0 | 1 | 2 | 3 | 4 | 5 | 6 | 7 | 8 | |
| -N+P | 0.000 | -1.468 | -1.269 | -1.488 | -0.993 | -0.782 | -0.332 | -0.264 | -0.415 |
| -N-P | 0.000 | -1.509 | -1.471 | -0.971 | -0.411 | -0.690 | -0.704 | -0.635 | -0.726 |
|
-N+P: Nitrogen starved in the presence of P-factor -N-P: Nitrogen starved in the absence of P-factor |