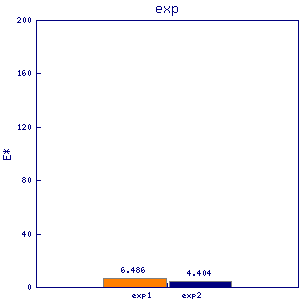
pho1
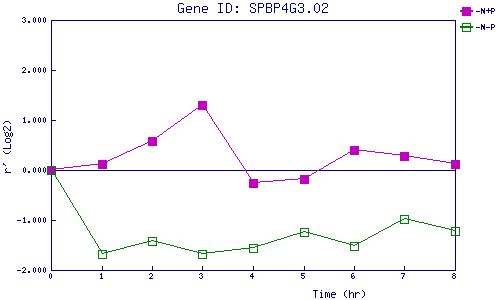
| 0 | 1 | 2 | 3 | 4 | 5 | 6 | 7 | 8 | |
| -N+P | 0.000 | 0.110 | 0.574 | 1.302 | -0.258 | -0.171 | 0.393 | 0.272 | 0.127 |
| -N-P | 0.000 | -1.681 | -1.413 | -1.688 | -1.552 | -1.238 | -1.514 | -0.976 | -1.212 |
|
-N+P: Nitrogen starved in the presence of P-factor -N-P: Nitrogen starved in the absence of P-factor |