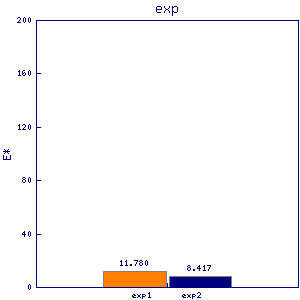
oxa1sp2 oxa102 oxa1 oxa1-2
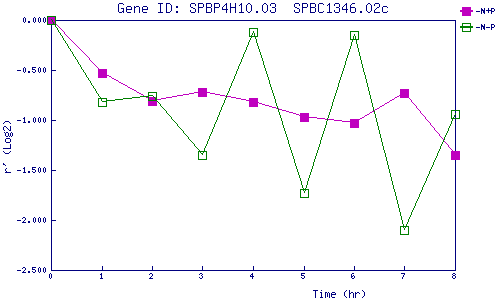
| 0 | 1 | 2 | 3 | 4 | 5 | 6 | 7 | 8 | |
| -N+P | 0.000 | -0.531 | -0.811 | -0.723 | -0.824 | -0.970 | -1.029 | -0.730 | -1.354 |
| -N-P | 0.000 | -0.817 | -0.755 | -1.347 | -0.117 | -1.728 | -0.149 | -2.101 | -0.936 |
|
-N+P: Nitrogen starved in the presence of P-factor -N-P: Nitrogen starved in the absence of P-factor |