ppb1
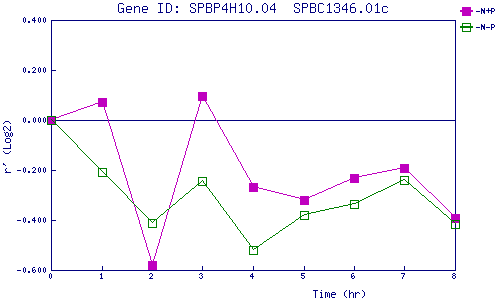
| 0 | 1 | 2 | 3 | 4 | 5 | 6 | 7 | 8 | |
| -N+P | 0.000 | 0.072 | -0.579 | 0.096 | -0.268 | -0.321 | -0.231 | -0.193 | -0.392 |
| -N-P | 0.000 | -0.207 | -0.413 | -0.245 | -0.521 | -0.381 | -0.335 | -0.240 | -0.418 |
|
-N+P: Nitrogen starved in the presence of P-factor -N-P: Nitrogen starved in the absence of P-factor |