spe2
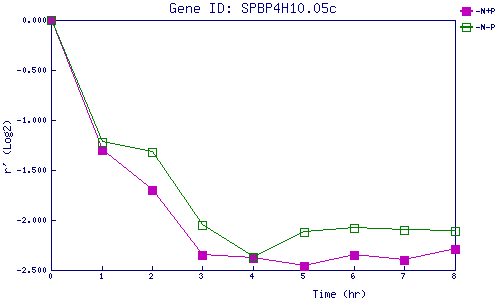
| 0 | 1 | 2 | 3 | 4 | 5 | 6 | 7 | 8 | |
| -N+P | 0.000 | -1.300 | -1.703 | -2.348 | -2.375 | -2.465 | -2.346 | -2.399 | -2.288 |
| -N-P | 0.000 | -1.216 | -1.325 | -2.050 | -2.366 | -2.123 | -2.080 | -2.096 | -2.109 |
|
-N+P: Nitrogen starved in the presence of P-factor -N-P: Nitrogen starved in the absence of P-factor |