cut14
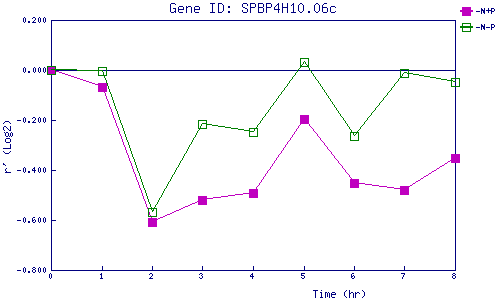
| 0 | 1 | 2 | 3 | 4 | 5 | 6 | 7 | 8 | |
| -N+P | 0.000 | -0.068 | -0.608 | -0.522 | -0.492 | -0.196 | -0.452 | -0.481 | -0.354 |
| -N-P | 0.000 | -0.003 | -0.569 | -0.218 | -0.250 | 0.033 | -0.265 | -0.013 | -0.050 |
|
-N+P: Nitrogen starved in the presence of P-factor -N-P: Nitrogen starved in the absence of P-factor |