rps23-2 rps2302
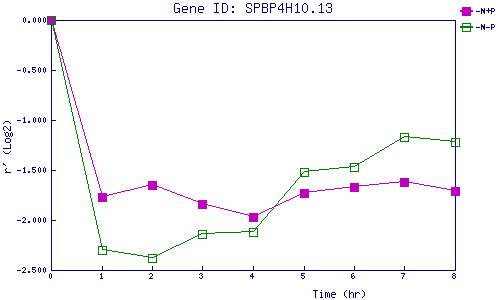
| 0 | 1 | 2 | 3 | 4 | 5 | 6 | 7 | 8 | |
| -N+P | 0.000 | -1.770 | -1.651 | -1.839 | -1.967 | -1.727 | -1.672 | -1.621 | -1.713 |
| -N-P | 0.000 | -2.305 | -2.379 | -2.135 | -2.124 | -1.518 | -1.466 | -1.171 | -1.223 |
|
-N+P: Nitrogen starved in the presence of P-factor -N-P: Nitrogen starved in the absence of P-factor |