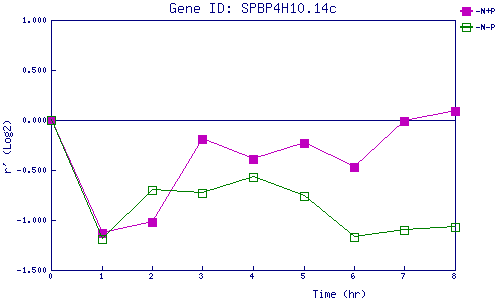
| 0 | 1 | 2 | 3 | 4 | 5 | 6 | 7 | 8 | |
| -N+P | 0.000 | -1.133 | -1.020 | -0.191 | -0.387 | -0.231 | -0.468 | -0.010 | 0.094 |
| -N-P | 0.000 | -1.192 | -0.701 | -0.727 | -0.570 | -0.758 | -1.169 | -1.105 | -1.071 |
|
-N+P: Nitrogen starved in the presence of P-factor -N-P: Nitrogen starved in the absence of P-factor |