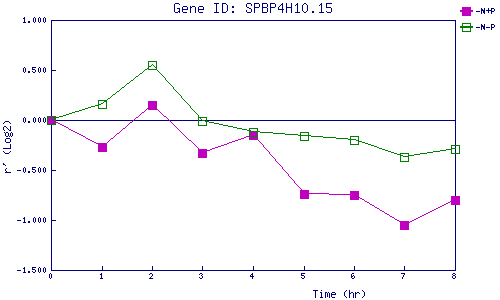
| 0 | 1 | 2 | 3 | 4 | 5 | 6 | 7 | 8 | |
| -N+P | 0.000 | -0.268 | 0.150 | -0.326 | -0.149 | -0.743 | -0.748 | -1.047 | -0.805 |
| -N-P | 0.000 | 0.157 | 0.554 | -0.006 | -0.120 | -0.162 | -0.197 | -0.367 | -0.292 |
|
-N+P: Nitrogen starved in the presence of P-factor -N-P: Nitrogen starved in the absence of P-factor |