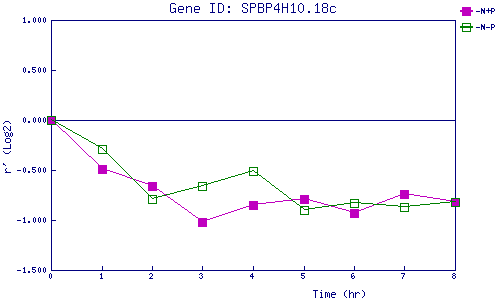
| 0 | 1 | 2 | 3 | 4 | 5 | 6 | 7 | 8 | |
| -N+P | 0.000 | -0.494 | -0.663 | -1.016 | -0.850 | -0.790 | -0.933 | -0.736 | -0.823 |
| -N-P | 0.000 | -0.294 | -0.786 | -0.662 | -0.508 | -0.905 | -0.832 | -0.867 | -0.825 |
|
-N+P: Nitrogen starved in the presence of P-factor -N-P: Nitrogen starved in the absence of P-factor |