nhm1 DcpS
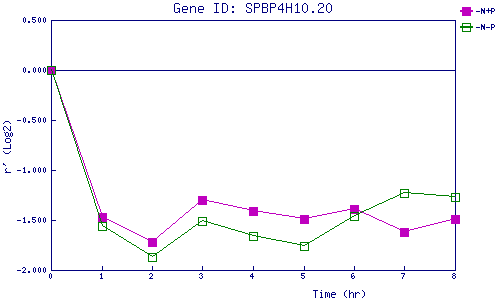
| 0 | 1 | 2 | 3 | 4 | 5 | 6 | 7 | 8 | |
| -N+P | 0.000 | -1.472 | -1.716 | -1.300 | -1.414 | -1.494 | -1.386 | -1.615 | -1.489 |
| -N-P | 0.000 | -1.558 | -1.869 | -1.506 | -1.664 | -1.760 | -1.456 | -1.229 | -1.270 |
|
-N+P: Nitrogen starved in the presence of P-factor -N-P: Nitrogen starved in the absence of P-factor |