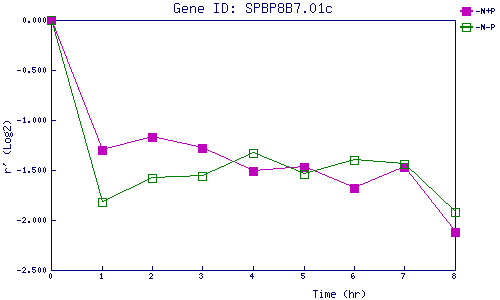
| 0 | 1 | 2 | 3 | 4 | 5 | 6 | 7 | 8 | |
| -N+P | 0.000 | -1.304 | -1.169 | -1.275 | -1.513 | -1.468 | -1.679 | -1.474 | -2.119 |
| -N-P | 0.000 | -1.817 | -1.585 | -1.563 | -1.333 | -1.543 | -1.397 | -1.437 | -1.921 |
|
-N+P: Nitrogen starved in the presence of P-factor -N-P: Nitrogen starved in the absence of P-factor |