rpl402 rpl4-2 rpl4
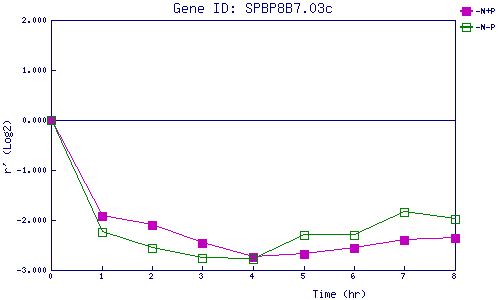
| 0 | 1 | 2 | 3 | 4 | 5 | 6 | 7 | 8 | |
| -N+P | 0.000 | -1.918 | -2.095 | -2.455 | -2.732 | -2.680 | -2.556 | -2.399 | -2.359 |
| -N-P | 0.000 | -2.243 | -2.557 | -2.750 | -2.778 | -2.292 | -2.292 | -1.832 | -1.971 |
|
-N+P: Nitrogen starved in the presence of P-factor -N-P: Nitrogen starved in the absence of P-factor |