rpp201 rpp2 rpp2-1
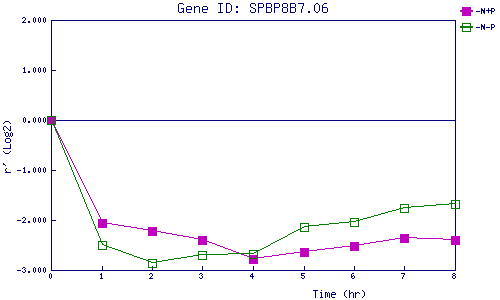
| 0 | 1 | 2 | 3 | 4 | 5 | 6 | 7 | 8 | |
| -N+P | 0.000 | -2.053 | -2.211 | -2.402 | -2.777 | -2.630 | -2.517 | -2.366 | -2.401 |
| -N-P | 0.000 | -2.495 | -2.869 | -2.701 | -2.674 | -2.144 | -2.036 | -1.768 | -1.679 |
|
-N+P: Nitrogen starved in the presence of P-factor -N-P: Nitrogen starved in the absence of P-factor |