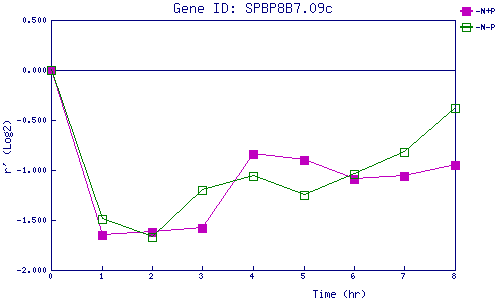
| 0 | 1 | 2 | 3 | 4 | 5 | 6 | 7 | 8 | |
| -N+P | 0.000 | -1.647 | -1.615 | -1.578 | -0.837 | -0.897 | -1.091 | -1.059 | -0.949 |
| -N-P | 0.000 | -1.487 | -1.672 | -1.200 | -1.060 | -1.246 | -1.043 | -0.824 | -0.381 |
|
-N+P: Nitrogen starved in the presence of P-factor -N-P: Nitrogen starved in the absence of P-factor |