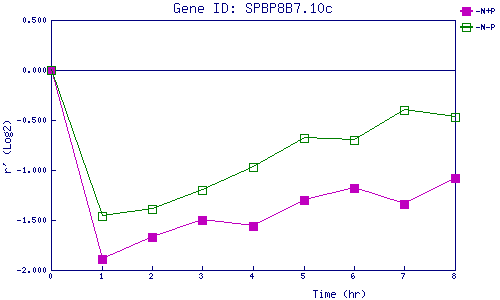
| 0 | 1 | 2 | 3 | 4 | 5 | 6 | 7 | 8 | |
| -N+P | 0.000 | -1.888 | -1.667 | -1.501 | -1.562 | -1.304 | -1.183 | -1.336 | -1.085 |
| -N-P | 0.000 | -1.461 | -1.394 | -1.196 | -0.969 | -0.675 | -0.702 | -0.403 | -0.469 |
|
-N+P: Nitrogen starved in the presence of P-factor -N-P: Nitrogen starved in the absence of P-factor |