Sp-snR47-sno
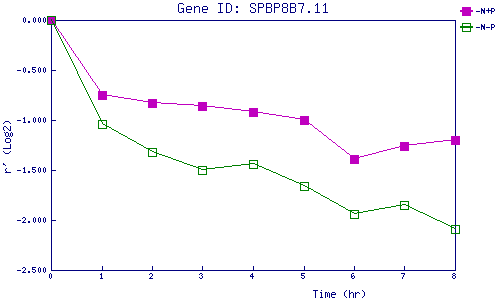
| 0 | 1 | 2 | 3 | 4 | 5 | 6 | 7 | 8 | |
| -N+P | 0.000 | -0.751 | -0.832 | -0.856 | -0.919 | -1.000 | -1.389 | -1.263 | -1.199 |
| -N-P | 0.000 | -1.038 | -1.322 | -1.497 | -1.439 | -1.655 | -1.937 | -1.853 | -2.090 |
|
-N+P: Nitrogen starved in the presence of P-factor -N-P: Nitrogen starved in the absence of P-factor |