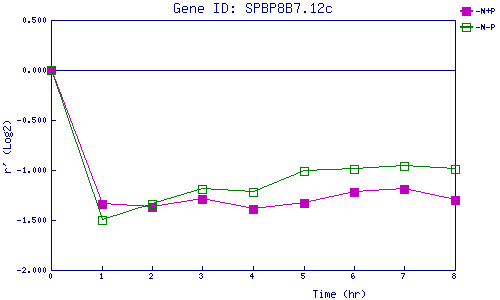
| 0 | 1 | 2 | 3 | 4 | 5 | 6 | 7 | 8 | |
| -N+P | 0.000 | -1.335 | -1.369 | -1.290 | -1.390 | -1.332 | -1.224 | -1.188 | -1.297 |
| -N-P | 0.000 | -1.502 | -1.343 | -1.192 | -1.215 | -1.009 | -0.987 | -0.960 | -0.990 |
|
-N+P: Nitrogen starved in the presence of P-factor -N-P: Nitrogen starved in the absence of P-factor |