dpb2
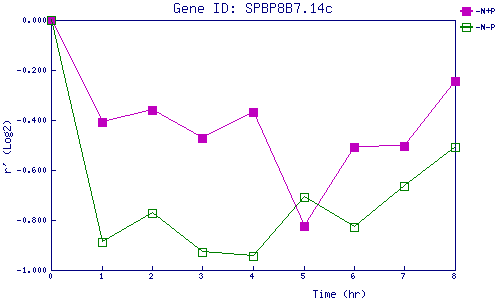
| 0 | 1 | 2 | 3 | 4 | 5 | 6 | 7 | 8 | |
| -N+P | 0.000 | -0.409 | -0.362 | -0.470 | -0.367 | -0.823 | -0.507 | -0.503 | -0.245 |
| -N-P | 0.000 | -0.887 | -0.773 | -0.928 | -0.944 | -0.709 | -0.828 | -0.666 | -0.509 |
|
-N+P: Nitrogen starved in the presence of P-factor -N-P: Nitrogen starved in the absence of P-factor |